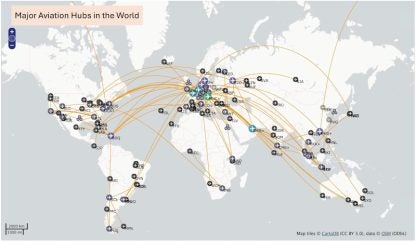
In today’s world, there are many similarities between dams that impound surface water and airports that represent aviation hubs or transit points for travel. A dam on a river receives surface water often from a dam or a set of dams located in the upstream region of the basin. As with any airport, there are many flights from other locations that fly to that airport.
In other words, any disruption in the operation and structural integrity of those upstream dams will eventually disrupt the dam in question, just like airport operations that are affected when arrival flights are delayed or cancelled. Conversely, a dam ‘serves’ or ‘regulates’ surface water to several dams in the downstream region of the same river basin just like an airport with flights departing to several destinations.
When looked at holistically, a single dam can be considered a transit hub of surface water drawing water from a vast region regulated by other dams just like a major airport. A single dam may also be a transit point for surface water before it flows into a major reservoir storage or redistribution for a variety of purposes such as hydropower, recreation (water sports, fish gaming) or irrigation.
Similarity to aviation industry
But what is the value of reimagining dams as transit hubs of surface water similar to the aviation industry? We argue here that such a perspective offers several benefits.
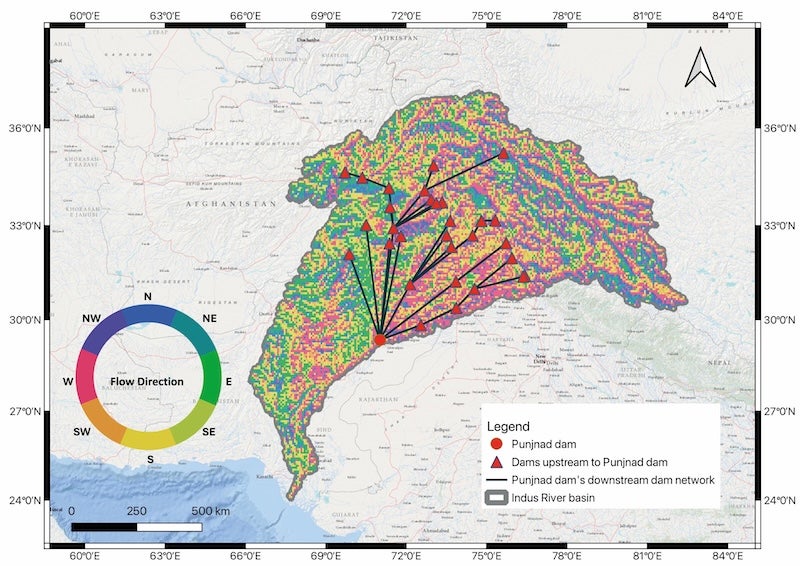
By adopting this approach, we can enhance our ability to adapt to climate change, ensuring a safer and more resilient supply of critical resources such as energy, food, and water that depend on dams. For any given dam, if we identify the set of upstream dams that regulate the surface water flowing into it, then we can immediately delineate a “boundary of influence” for that specific dam.
If any of these dams in the upstream suffer extreme events such as drought, catastrophic floods (overtopping embankments), or even a dam break, we can develop plans and protocols to prepare the dam in question accordingly, to minimise operational disruptions and maintain safety, especially if the dam is classified as high hazard (i.e. located upstream of a major population center).
For example, consider the scenario of a major contaminant leak through the spillway of one of the upstream dams that needs to be contained for public safety. Knowing the “boundary of influence” allows us to pinpoint the contaminant pathway and potential time taken to reach the dam in question that may be a vital regulation point for supplying drinking water for the public.
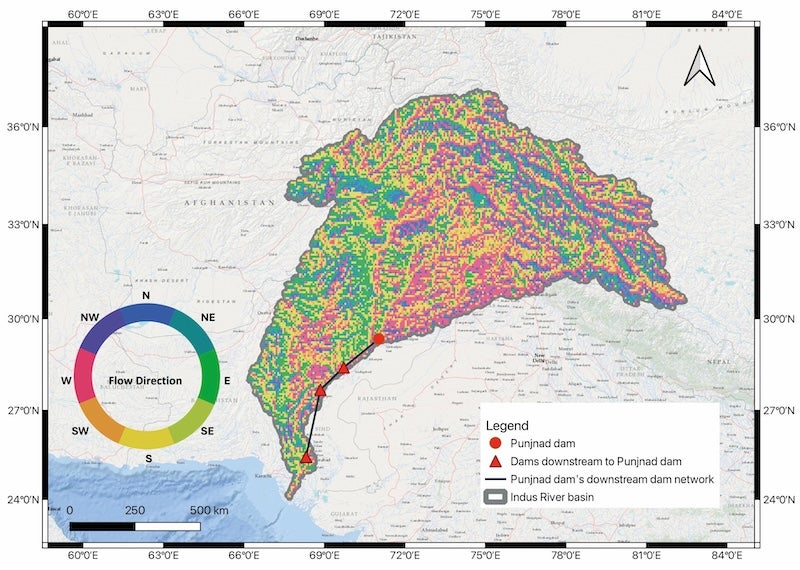
Similarly, by identifying the downstream dams that are directly affected by the operation or structural integrity of the dam in question, we can establish a corresponding “boundary of influence”. In this case, the operator of the dam in question gets to know which specific dams require coordination or engagement to ensure optimal water allocation and that the overall objectives of water management meet the needs of the local population. Alternately, the dam can choose to change its operating policy to aid the downstream dam in need of more water or flood protection.
A good example of this occurred in 2016 when an upstream dam in China released more water than its normal operating policy to assist a downstream dam in Vietnam on the Red River to mitigate a drought [1,2]. In contrast, one of the upstream dams in the upper Mekong River basin in China reportedly reduced the water release by half, in July 2019, resulting in lower-than-usual level of water in the Mekong delta [3].
Many studies show that release of additional water could have helped the lower Mekong delta region in Vietnam cope with the drought and even would have helped reducing salinity in the freshwater [4, 5 and 6]. Recently it has been claimed that even in contentious and highly dammed river basins such as the Blue Nile [7] or Tigris Euphrates, countries actually benefit more if such upstream and downstream coordination between a network of dams is carried out at tactical scales [8]. Even for successful upstream fish migration, implementing optimal and harmonised operating rules across dams can be highly effective [9 and 10].
It’s time to empower the world with software to visualise dams globally, using affordable, open-source, and open-science tools, and help reimagine them as transit hubs. This visualisation can have numerous benefits for management of key livelihood resources that dams control – energy (hydropower), food (from irrigation projects) and drinking water – while supporting the development of more robust policies to adapt to environmental extremes driven by climate change. Such a tool can also have educational value in teaching surface water management and environmental stewardship of natural resources in the classroom. The tool can help design field experiments to monitor and track sediment transport, explore fish migration in regulated rivers, to name a few.
Introducing DamNet for dams
Driven by the need to develop a visualisation tool that reimagines dams as hubs and transit points, we hereby present “DamNet”. DamNet uses a network theory algorithm to identify geolocated dams that are upstream or downstream of a given dam for a given flow path. In the current version of the tool, the network algorithm has already been applied to a classic dam database of GRanD (Global Reservoirs and Dams database) containing 7000 dams [11]. The network algorithm used was part of a Reservoir Operations driven River Regulation (ResORR) model [12]. However, the network algorithm has the functionality to allow user to provide their own dam database and flow direction file or river network.
DamNet can accessed from here – https://depts.washington.edu/saswe/damnet/ and when user hovers a mouse over a dam, there are options for identifying dams downstream or upstream. At each dam location, key information about the dam emerges in the visualization.
Visualisation tool for dams
The DamNet visualisation tool is developed using an Observable Notebook, an interactive and editable document format ideal for data visualisation [14]. This notebook allows for the creation of visualisations that can be embedded in a website. The interactive visualisation itself is built using a network graph, written in JavaScript with the d3 library [15].
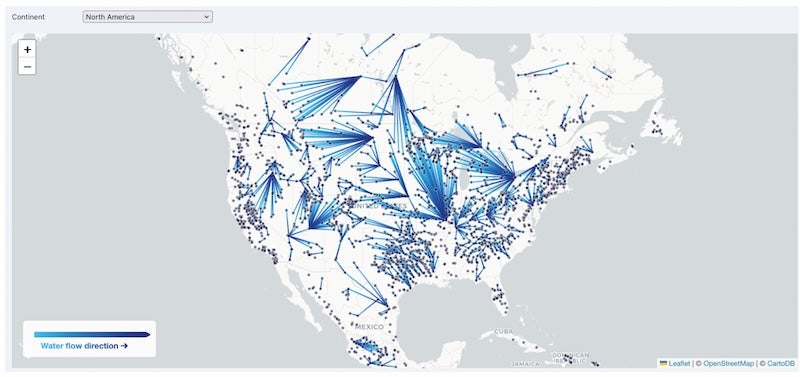
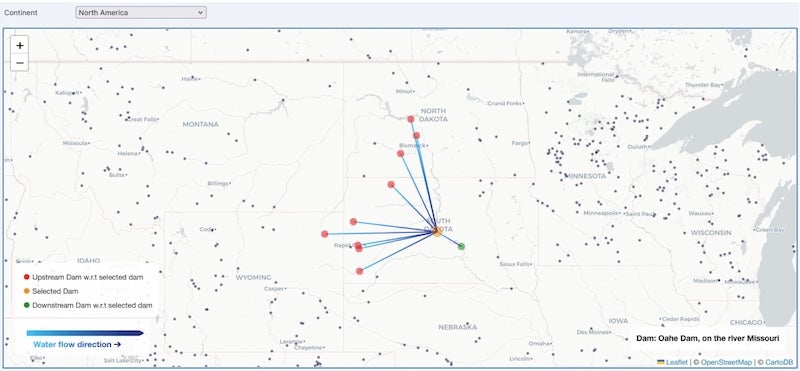
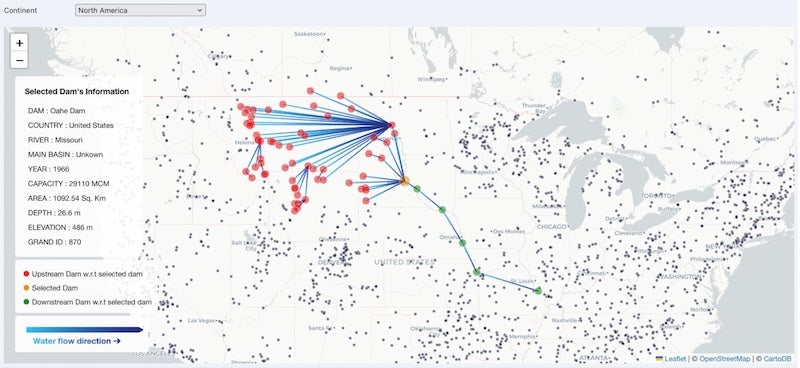
Users can select a specific continent or choose ‘All Continents’ to view dams in their region of interest (Figure 4). When hovering over a dam, the tool highlights immediate upstream dams in red and the immediate downstream dam in green, while the selected dam is displayed in yellow. The dam’s name and the river it is built on are shown in the lower right corner (Figure 5). Clicking on a dam reveals the entire network associated with it, displaying all upstream and downstream dams relative to the selected dam (Figure 6).
The color scheme—red for upstream dams, yellow for the selected dam, and green for downstream dams—mirrors the flow of traffic at an intersection, with red indicating incoming flow, yellow for the point of inspection, and green for outgoing flow. Additionally, flow direction edges are represented by a gradient blue color, where the shade deepens as water flows from multiple upstream dams towards a downstream dam.
Stewardship
There is a myriad of explorations that one can do with DamNet, especially if the user uses a more comprehensive dam database (for example GDAT and GOODD) [16 and 17] with more detailed and high-resolution flow direction data from the world’s rivers (example, GRWL and SWORD dataset) [18 and 19]. These explorations can serve educational purposes or be driven by research questions.
In this article, we have presented the big picture value of DamNet as a visualisation tool that allows dams to be reimagined as transit hubs of the world’s water. We hope users will find the tool valuable, build upon it with more comprehensive datasets and by adding more layers of information to the visualisation to deepen the community’s understanding of dams in the stewardships of key resources and services that depend on surface water.
References
- Mai, N. P., Kantoush, S., Sumi, T., Thang, T. D., Trung, L. V., & Van BINH, D. (2018). Assessing and adapting the impacts of dams operation and sea level rising on saltwater intrusions into the Vietnamese Mekong Delta. Journal of Japan Society of Civil Engineers, Ser. B1 (Hydraulic Engineering), 74(5), I_373-I_378. https://doi.org/10.2208/jscejhe.74.5_I_373
- Le Tran, L. T., & Nguyen, T. A. H. (2023). Navigating Water Policy: Vietnam’s Strategic Shift in the Mekong River Basin (2017-2021). Resolusi: Jurnal Sosial Politik, 6(1), 60-75. https://doi.org/10.32699/resolusi.v6i1.3704
- Lu, X. X., & Chua, S. D. X. (2021). River discharge and water level changes in the Mekong River: Droughts in an era of mega‐dams. Hydrological Processes, 35(7), e14265. https://doi.org/10.1002/hyp.14265
- Park, E., Loc, H. H., Van Binh, D., & Kantoush, S. (2022). The worst 2020 saline water intrusion disaster of the past century in the Mekong Delta: Impacts, causes, and management implications. Ambio, 51(3), 691-699. https://doi.org/10.1007/s13280-021-01577-z
- Nhung, T. T., Le Vo, P., Van Nghi, V., & Bang, H. Q. (2019). Salt intrusion adaptation measures for sustainable agricultural development under climate change effects: A case of Ca Mau Peninsula, Vietnam. Climate Risk Management, 23, 88-100. https://doi.org/10.1016/j.crm.2018.12.002
- Ho, M., & East Brewton, A. L. The Effects of Drought and Salinity on the Vietnamese Mekong River Delta.
- Eldardiry, H., & Hossain, F. (2019). Understanding reservoir operating rules in the transboundary nile river basin using macroscale hydrologic modeling with satellite measurements. Journal of Hydrometeorology, 20(11), 2253-2269. https://doi.org/10.1175/JHM-D-19-0058.1
- Hossain, F., Alwash, A., Minocha, S., & Eldardiry, H. (2023). Restoring the Mesopotamian rivers for future generations: A practical approach. Water Resources Research, 59(5), e2023WR034514. https://doi.org/10.1029/2023WR034514
- Zhang, P., Qiao, Y., Jin, Y., Lek, S., Yan, T., He, Z., Chang, J. & Cai, L. (2020). Upstream migration of fishes downstream of an under-construction hydroelectric dam and implications for the operation of fish passage facilities. Global Ecology and Conservation, 23, e01143. https://doi.org/10.1016/j.gecco.2020.e01143
- Yang, B. H., Yin, X. A., Gao, Z. J., Liu, H. R., & Xu, Z. H. (2024). Reservoir operating rules to create effective fish migration passages in a reservoir. Water Resources Research, 60(8), e2023WR035429. https://doi.org/10.1029/2023WR035429
- Lehner, B., Liermann, C.R., Revenga, C., Vörösmarty, C., Fekete, B., Crouzet, P., Döll, P., Endejan, M., Frenken, K., Magome, J. and Nilsson, C. (2011). High‐resolution mapping of the world’s reservoirs and dams for sustainable river‐flow management. Frontiers in Ecology and the Environment, 9(9), 494-502. https://doi.org/10.1890/100125
- Das, P., Hossain, F., Minocha, S., Suresh, S., Darkwah, G.K., Lee, H., Andreadis, K., Laverde-Barajas, M. and Oddo, P. (2024). ResORR: A globally scalable and satellite data-driven algorithm for river flow regulation due to reservoir operations. Environmental Modelling & Software, 176, 106026. https://doi.org/10.1016/j.envsoft.2024.106026
- Wu, H., Kimball, J. S., Mantua, N., & Stanford, J. (2011). Automated upscaling of river networks for macroscale hydrological modeling. Water Resources Research, 47(3). https://doi.org/10.1029/2009WR008871
- JE, O., & CT, T. (2021). Reactive, reproducible, collaborative: computational notebooks evolve. Nature, 593. https://doi.org/10.1038/d41586-021-01174-w
- Bostock, M., Ogievetsky, V., & Heer, J. (2011). D³ data-driven documents. IEEE transactions on visualization and computer graphics, 17(12), 2301-2309. https://doi.org/10.1109/TVCG.2011.185
- Zhang, A. T., & Gu, V. X. (2023). Global Dam Tracker: A database of more than 35,000 dams with location, catchment, and attribute information. Scientific data, 10(1), 111. https://doi.org/10.1038/s41597-023-02008-2
- Mulligan, M., van Soesbergen, A., & Sáenz, L. (2020). GOODD, a global dataset of more than 38,000 georeferenced dams. Scientific Data, 7(1), 31. https://doi.org/10.1038/s41597-020-0362-5
- Allen, G. H., & Pavelsky, T. M. (2018). Global extent of rivers and streams. Science, 361(6402), 585-588. https://doi.org/10.1126/science.aat0636
- Altenau, E. H., Pavelsky, T. M., Durand, M. T., Yang, X., Frasson, R. P. D. M., & Bendezu, L. (2021). The Surface Water and Ocean Topography (SWOT) Mission River Database (SWORD): A global river network for satellite data products. Water Resources Research, 57(7), e2021WR030054. https://doi.org/10.1029/2021WR030054
- OpenFlights.org: Flight logging, mapping, stats and sharing. (Last Accessed: 1st September 2024). https://openflights.org/#google_vignette
Acknowledgments
This work was borne out of a graduate course at the University of Washington, “CSE-512 Data Visualisation” taken by the first author (Minocha) during Spring quarter of 2024. Gratitude is expressed to peers Alyx Peiyao Xiao and Peihsin Wang for their support and assistance in this project.
Research Material Statements
URL of the repository containing raw and processed data, observable notebook and python codes: https://osf.io/e7h8k/?view_only=8a9b1d3415de42f19b9853316a3003f4


