Climate change versus Swiss hydro – what happens next?
26 June 2012A recent research collaboration has updated previous estimates about climate change’s influence on future Swiss hydro power production. Rolf Weingartner, Bruno Schädler and Pascal Hänggi from the University of Bern give an interesting insight into their work.
The hydrologic cycle is directly linked to weather patterns and thereby with climate, which increasingly is subject to anthropogenic influences. In the Alps, the hydrologic cycle responds with particular sensitivity to climate warming because changes in seasonally increasing and decreasing snow cover and long-term variability in the advance and retreat of glaciers have a direct impact on available water resources. Since around 56% of electricity in Switzerland is produced by water power (BFE 2007), changes in the hydrologic cycle brought about by climate change are of utmost importance to medium- to long-term planning for the Swiss electricity supply and the operation of individual hydropower plants.
The Federal Office of Energy has carried out several studies on the energy outlook in Switzerland. In addition to the assessment of extending and building new hydroelectric power plants, the effects of climate change were included in the analyses. In the latest study (BFE 2007), it was assumed that hydroelectric generation will decline by about 7% by 2035 and 17% by the end of the 21st century. These conclusions are based on hydrological simulations in 11 mostly alpine catchments (Horton et al. 2005) using the climate scenarios of the PRUDENCE project (Christensen et al. 2002).
However, in recent years the methods for estimating hydrological changes due to climate change have improved considerably. Comprehensive new regional climate scenarios were developed in the European research project ENSEMBLES (van der Linden and Mitchell 2009), forming the basis for more refined climate scenarios for Switzerland (CH2011 2011, Bosshard 2011, Bosshard et al. 2011), while substantial progress also has been made in hydrological modelling (Viviroli et al. 2009, Magnusson et. al 2011, Hänggi 2011).
In 2008 swisselectric research (a subsidiary of the association of the major Swiss electricity grid companies) together with the Federal Office of Energy, launched a new quantitative assessment of the impact of climate change on water resources and electricity generation in Switzerland. Also involved in the initiation of the project—hereafter referred to as CCWasserkraft—were the cantonal Department for Energy and Water Power of Valais and the power company FMV SA.
The goal of CCWasserkraft was to investigate the effects of climate change on:
• Run-off and in particular the flow regimes in representative catchments in Switzerland.
• The operation and thus the electricity generation of typical power plants.
• Electricity generation in the whole of Switzerland.
Divided into several subprojects coordinated by the Mountain Water Network and under the scientific direction of the Institute of Geography of the University of Bern (Rolf Weingartner, Bruno Schädler) and the Swiss Federal Institute for Forest, Snow and Landscape Research (Massimiliano Zappa), the project was carried out by six research groups.
This paper summarizes the most important results of CCWasserkraft. The Project Summary Report (SGHL and CHy 2011) and the Technical Reports (Fachberichte 2011) provide more comprehensive insight into the results.
METHODS
Runoff is the key parameter of the CCWasserkraft project, which is a matter, first, of understanding the evolution of flow conditions in the period 1900-2100, and then simulating the impacts of changes such as these on current production. To accomplish this, three model systems were linked with each other as shown in figure 1. All three model systems were coupled in particular subprojects (Hänggi et al. 2011a, Stähli et al. 2011), while in others combined hydro-climatological models stood at the centre (Farinotti et al. 2011, Hänggi 2011).
The different climate model chains of the EU project ENSEMBLES (van der Linden and Mitchell 2009), which are driven by emissions scenario A1B (see for example IPCC 2007), form the core of the climate modelling. They consist of global climate models (GCMs) with coarse resolution, the results of which were dynamically downscaled by means of regional climate models (RCMs) to a resolution of 25km. This is necessary so that atmospheric processes can be modelled over the complex terrain of the Alps. To correct modelling errors and increase spatial resolution, the RCM data were further processed using statistical methods. The delta change method was applied and the observational data series (temperature and precipitation) of all MeteoSwiss stations were scaled with a climate change signal (Bosshard et al. 2011). The climate change signal is derived from a comparison between the scenario period (SCE, 2021-2050) and the control period (CTL, 1980-2009). A total of ten combinations of different GCMs and RCMs having been taken into account, ten different climate model inputs were available for the hydrological and hydroglaciological models.
Several deterministic distributed hydrological models were employed: PREVAH (Viviroli et al. 2009), BERNHYDRO (Hänggi 2011), and GERM (Huss et al. 2008). Comparison with observed runoff in representative areas showed that the models can reproduce hydrological conditions well. In the power station modelling, the discharges from the different model inputs were passed to an operations model of the power plant installations being studied so that the effects on power output and revenue could be computed.
Among others, the software Timesteps-Energy 2010 (Blöchlinger et al. 2004) and WABES (AF-Colenco 2004) were used to calculate the optimal operation of the power plants for yield maximization taking into account the simulated flow - that is, plant intake. Over the scenario period 2021–2050, important parameters such as electricity rates and demand were preserved unchanged from present values in each calculation.
The model chain shown in figure 1, or parts thereof, was applied to different catchments in Switzerland. These areas were selected according to four criteria:
(1) The availability of long series of natural flows.
(2) Coverage of the 16 types of flow regimes in Switzerland (see Weingartner and Aschwanden 1992).
(3) Glaciologically interesting, well documented areas.
(4) A typical hydroelectric power installation (see Balmer 2011).
Criterion (1) was brought to bear from the analysis of Hänggi and Weingartner (2011), which examined the temporal development of precipitation and flow of the Rhine at Basel since 1800. Hänggi et al. (2011b) examined the change in flow regimes between 1900 and 2100 over representative Swiss catchments with long series of measurements (criteria 1 and 2). Farinotti et al. (2011) simulated the flow behaviour of strongly glaciated catchments in the same period (criterion 3). Glaciers are strikingly affected by climate change.
Finally, the full model chain of figure 1 was used in areas that meet criterion (4) and, partially, criterion 2 (Hänggi et al. 2011a, Stähli et al. 2011). In these areas, direct statements can be made about the effects of climate change on electricity generation.
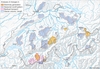
Figure 2 provides an overview of the areas that were examined and shows how the hydrological variety of Switzerland was captured. Because the better part of hydropower is produced in Alpine areas the constituent case studies covered by the complete model chain lie predominantly in those areas. In addition—but not further described here—the consequences of changing runoff conditions were also examined for sediment transport (Raymond et al. 2011).
In the end, an important goal of this project was to use the results from the areas investigated (figure 2) to estimate how overall Swiss power generation will change in the period 2021–2050 compared to today. Extrapolation was therefore carried out (Hänggi et al. 2011c) based on a combination of two classifications:
• In the first, hydropower installations that are similar from a technical and geographical viewpoint were grouped together (Balmer in 2011).
• In the second regions with a similar change in climate signal were identified with statistical methods and grouped together.
Via a combination of these classifications, power station groups emerged that differ with respect to technical, geographical characteristics and/or expected changes in the climate change signal. Next, the results of the case studies, i.e. the predicted changes in water flow and electricity generation, were assigned to these groups of power stations. Assisted by these assignments, and because the size of each power station group’s contribution to the overall power generation of Switzerland is known (Balmer 2011), a projection for the whole of Switzerland could be carried out. It was assumed that changes in flow directly affect electricity production from run-of-river power plants, whereas the case study results allow changes to electricity production of reservoir storage power plants to be estimated since in these plants the coupling of runoff and power generation is not linear.
RESULTS
The CCWasserkraft project has generated a wealth of results going well beyond the scope of this article. In accord with the objectives mentioned in the Introduction, three relevant aspects shall be emphasised below.
Effects of climate change on runoff and in particular flow regimes
A homogeneous series of measurements since 1808 is available for the Rhine at Basel (figure 3). The catchment drains a large part of northern Alpine Switzerland with a surface area of approximately 36,000 km2 and thus yields integrated information on the temporal development of runoff in this area.
Changes in the mean behaviour and interannual variability of the data were analysed by using moving statistical distributions over 30 years (Hänggi and Weingartner 2011). The results show that the long-term average annual flow of the 20th century is greater than that of the 19th century (the difference is statistically significant). The transition to higher flows is temporally bounded and found around 1930 (figure 3). A sharp increase in flow is discernable in both winter (Dec.–Feb., figure 3) and spring (Mar.–May).
A sensitivity analysis has further shown that in winter air temperature is more important for changes in flow quantity than precipitation, whereas for the annual quantity and in spring precipitation is the main driver of flow. Overall, the results show that the conditions for hydroelectric power production over time have steadily improved. For example, the increase in winter flow has a positive effect on electricity generation in run-of-river power plants (cf. 3.3).
In the following, flow regime changes in representative mesoscale Swiss catchments are analysed over the interval 1951–2100. The results in figure 4 show that changes are pronounced in the Alpine region: the flow regimes of the representative areas have and/or will change around one to two regime stages (see legend, figure 4). This is due to changes in the process of ice and snow melting as shown in the following two examples.
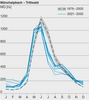
Plessur-Chur is representative of a flow regime controlled by snowmelt (compare figures 4 and 5). Typical of such a regime is the following sequence of the highest average monthly flows: June, May, July, August (Weingartner and Aschwanden 1992). In the 2021–2050 scenario this sequence will change because from June to August flows decline significantly due to the earlier onset of snow melting. The average flows in May and April thus become relatively more significant, and winter flow will increase. Overall, the regime changes to a nival de transition type (see figure 4). Although alteration of the mean annual flow is not significant, seasonal shifting of flow behaviour does take place.
Seasonal shifts are also observed in the flow regime, shaped by glacial melt, of the Simme (compare figures 4 and 6), for which a decline of glacier volumes accounting for an increased supply of melt water is decisive. Both seasonal flow patterns and annual volumes have thereby changed, and will continue to change. On the basis of investigations of other glaciers, Farinotti et al. (2011) were able to show that annual flow volumes of heavily glaciated catchments are at their highest at present, and that from the middle of the 21st century these will return to the level of the first half of the 20th century. However, at the end of the 21st century flow behaviour will no longer be governed by glacial melt but by the seasonal pattern of melting snow and precipitation.
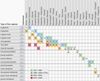
Table 1 summarises the results of the modelling for the 16 representative catchments. The largest changes observed are in the still heavily glaciated catchments in which flows will rise significantly on both an annual and semi-annual basis. In the remaining northern Alpine catchments, the annual volumes will remain at a similar level while overall flows will increase in winter and decrease in summer. Results for the southern side of the Alps are few; taking into account the results of climate modelling (Bosshard et al 2011), especially at lower altitudes a decline in runoff is to be expected.
Effects of climate change on the operation and electricity generation of typical power plants
Runoff, electricity generation, and revenue are not always connected to each other in a linear way. Crucial to the relationship of these factors are the type of power plant and the distinct design of each installation. In the CCWasserkraft project, different case studies were carried out in which the model chain (figure 1) was analysed to reach conclusions about the effects of climate change on electricity generation. In the following example, the Prättigau power station case study is discussed (Hänggi et al. 2011a). The Prättigau power station (KW Prättigau) is an example of a type of generating station that generates approximately 9% of Swiss hydroelectricity (Hänggi et al. 2011c).
KW Prättigau lies in the canton of Graubünden; it includes nine water intakes, three power levels, and small seasonal storage. Simulations based upon eight different realizations of the A1B emissions scenario and one of the A2 emissions scenario show that now mostly glacio-nival (ice and snow fed) flow regimes (figure 4) in the seven subcatchments will clearly change in the near future (2021–2050) (figure 7): higher outflows from September to May and lower outflows from June to August are expected. Seasonal changes affect annual flow volumes slightly; increases of 1–8% are anticipated. Yet flow regime changes have extensive effects on power generation.
As figure 7 shows, winter production increases 20–40%, while summer production is little changed. Viewed over the whole year, this results in increased power generation of around 9%. The production increase in winter is due to the fact that the additional flow can be completely captured and used. Similarly in the future, a sufficient amount of water can be taken from the water courses during the summer since, in most cases, the supply quantities are still larger than the intake capacities.
In the case of KW Prättigau, the finding of improved utilization of winter intake capacity (and thus increased power generation in the period 2021–2050) is confirmed by the other studies carried out by CCWasserkraft: the results show no change or a decrease of summer electricity generation. Over the whole year, only small changes are to be expected with slightly negative changes in southern and eastern Valais. However, uncertainty of ±10% must be taken into account (SGHL and CHy 2011).
Statements about the distant future (2085) are still very uncertain and depend on regional differences in rainfall, as well as the altitude and degree of glaciation of catchments. Based on our preliminary findings, the trends in power generation—particularly for the high altitude, currently heavily glaciated areas of southern and eastern Valais and the southern side of the Alps—are negative.
The effects of climate change on power generation in the whole of Switzerland
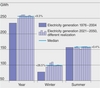
The projections for Switzerland presented above include an optimistic and a pessimistic case. In the optimistic case, in run-of-river plants summer flow quantities are always higher than the intake capacities of these hydroplants; in the pessimistic case, this is not always true. Table 2 summarizes the results. In each alternative there is an expectation of slightly increased average power generation for Switzerland. Taking into account overall uncertainties that can be quantified only roughly, the results of the projections can be interpreted as indicating that no significant changes in average annual power generation are expected compared with the present.
The changes in the summer and winter half-years are, however, remarkable. In the summer, power generation in Switzerland overall as well as in most power plant groups will on the whole decrease in most cases by 3–10%. In the winter, however, most power stations can expect an increase in electricity production in a range of 2–26%; winter power production for the country as a whole is projected to increase in the near future by 10.1%. Winter decreases are projected only for power plants in southern Ticino.
For the more distant future, in the period 2070–2099, these statements do not apply. Model calculations show, for example, that flow quantities from glaciated areas will decrease significantly (Farinotti et al. 2011), accompanied by major glacial retreat by the end of the century (Paul et al. 2011) and a decrease in summer precipitation (Bosshard et al 2011).
Conclusions
As noted earlier, the impact of climate change on hydropower was estimated in 2007 (FOE 2007). A 7% decrease in average electricity generation emerged from an analysis in which the runoff changes in 11 Alpine catchments were estimated (Horton et al. 2005) for the period 2020-2049 based on older, lower resolution climate scenarios (Christensen et al. 2002). But the results of the case studies presented here show that projections for Switzerland based only on runoff are problematic because a naturally occurring amount of water is not necessarily equal to the amount of water that is usable for power generation. The projection for Switzerland carried out as part of CCWasserkraft took a significant step further: in addition to natural flow changes it took into account the design and intake capacity of individual hydroelectric power plants.
The results of this Swiss study are also supported by a comparable investigation (Schöner et al. 2011) that projected an average annual increase in electrical generation of 0.5–2.5% for Austria for 2021–2050 compared with 1976–2006.
Although annual production will change little, in the near future changes in seasonal average power production are to be expected. What does this mean for the operators of hydroelectric power plants? As Spreng (2011) commented: ‘Climate-related optimisation of operations should entail no major problems.’
Changes in the electricity market as well as year-to-year, weather-related variability are larger than the trends brought about by climate change. In a lecture in Visp in September 2011, the Director of the Valais power concern FMV SA, Paul Michellod, said: ‘Optimisation of operations must meet all changes in the short term, and in so doing will catch constant but from moment to moment and year to year hardly perceptible climate-induced changes.’ Michellod pointed to potential problems for power station operators and stressed two in particular:
1. The possibility of large flood events could increase.
2. The retreat of glaciers exposes more detritus surfaces in the high Alps, thereby greatly increasing the quantity of sediment.
The combination of these two factors will give rise to increased siltation of water intakes and reservoirs and thus have a negative impact on power generation, according to Michellod. In spite of an overall favourable outlook for power generation in Switzerland in the near future, this confirms that in individual cases depending upon geographic location, catchment and type of plant, the effects of climate change on hydropower can be substantial.
Rolf Weingartner, Bruno Schädler and Pascal Hänggi, Group for Hydrology, Institute of Geography and Oeschger Centre for Climate Change Research, University of Bern, CH-3012 Bern, Switzerland
TablesTable 1 Table 2