Going Dutch
17 November 2004O.A.C. Hoes, W. Schuurmans and J.Strijker explain how risk analysis was used to anticipate the effect of climate change on regional water systems in the Netherlands
HEAVY rainfall in recent years has shown in many countries that occasional flooding cannot always be prevented (i.e. Elbe,Germany 2002; Jakarta, Indonesia 2002, Yangtze, China 1998). Furthermore, it is likely that the frequency of flood events and accompanying material damage will increase in the future due to expected climate change, sea level rise, subsidence, deforestation, improved drainage and ongoing urbanisation etc. So in order to keep the risk of flooding under control, many water systems need to be upgraded on a large scale. The national government, provincial governments and water boards in the Netherlands have formulated an action program to prepare all Dutch rural and urban surface water systems for future changes.
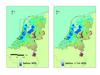
The Netherlands is situated in the Delta of three rivers: The Rhine, The Meuse, and the Scheldt. As a result of this unique location the country was able to develop into a densely populated area. The area is a transition zone between water and sea, which consists of fertile soil, near infinite marine resources, and it is an intersection point for the transshipment of merchandise. However, this development has also made the country vulnerable to floods, as large parts are flat and located near or below mean sea level (See Figure 1). These low areas are protected against the sea by dunes and levees, and dewater precipitation by pumping stations. Besides floods caused by breaches of dunes and levees, floods can also be caused by heavy rainfall, which are at most 10 to 20cm.
After several flood incidents in 1998, 2000 and 2001 the government proposed standards with regards to flooding accidents due to heavy precipitation (See Table 1). The objective of the standards was to inform residents on the level of protection which can be expected and to anticipate expected climate change. These standards consist of a maximum flood frequency for different types of land use. The rationale behind the standards is that more expensive areas should be better protected than others. All 37 water boards in the Netherlands are presently evaluating whether the water systems in their regions meet the proposed standards, and if not, they are required to define the necessary financial, and technical, efforts to comply with the standards. The proposed standards will be evaluated and formalised at the end of 2005.
All 37 water boards in the Netherlands are obliged to check their water systems, with respect to flooding, and to formulate measures to improve these water systems. The measures have to be carried out before 2015, and the costs for the Netherlands are estimated at US$11.7B.
The question is however, whether these standards are a proper way to insure that effective and cost efficient measures are taken. This question can be answered by applying risk analysis. The cost benefit ratio of measures necessary to comply with the standards can be determined with this analysis. In this article the proposed standards, and rationale behind risk analyses are explained and illustrated with a case study of the regional water systems in the province of North Holland, The Netherlands. This case study is based on a three-year research study carried out by Hollands Noorderkwartier Water Board, North Holland province, Nelen & Schuurmans Consultants and Delft University of Technology.
Evaluation of the standards
Water Board Hollands Noorderkwartier and the North Holland province have evaluated the flood standards, on the basis of a cost benefit analysis (See the rectangle in figure 1 for the study area). In this analysis, the costs are determined by the measures needed to comply with the proposed standards. But what are the benefits of the standards? The benefits are the reduction of flood risk, which is in turn defined by the probability times the consequences.
A big effort was required to determine the flood probabilities and damage on a detailed scale. First a reliable and detailed computer simulation model of the water systems in the area was made. Probability distribution functions of simulated water levels were determined for both the actual and future situation (expected climate change) using this model and 100 years of historic rainfall and evaporation records. For the areas which did not comply with the standards, improvement measures were formulated. In addition, sets of alternative measures were made that were less costly. Finally, a cost benefit analysis for the various packages of measures was carried out.
Frequency of extreme events
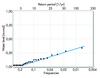
To determine the frequency of extreme water levels a simulation model is essential as sufficient suitable measurement data are not usually available. A combined rainfall runoff and hydraulic model was applied to simulate water levels. The model of the Noorderkwartier contained over 200,000 parameters. Simulations of hundred years of hourly rainfall were used to determine reliable probability distribution functions of water levels for about 2000 locations in the area. These distribution functions were determined by fitting a Gumbel distribution through the annual maxima (See Figure 3). At each location the probability distribution function of water levels was compared to a digital terrain model of the area. It was found that one out of 10 locations does not meet the criteria from table 1.
Climate change
To determine the impact of climate change, the same procedure was followed with adapted rainfall and evaporation series. (See Table 2). All water boards in the Netherlands agreed to use a climate scenario in which the average temperature in the Netherlands rose with 1 degree (?T = 18C) as the situation in 2050. It was found that in 2050 nearly one of six locations would not meet the standards.
Measures
In essence there are two possibilities to comply with the standards: a relocation of expensive land use towards less vulnerable land use functions or changing the water system. In this study, land use has not been altered. A wide range of measures is available to change the water system in order to lower the probability distribution function in such a way that the area meets the standards. The measures applied were a combination of increasing the storage capacity, by increasing the open water area, increasing the discharge capacity (pumps and weirs) and applying real time control to make optimal use of the installed storage and discharge capacities.
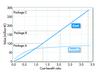
To determine which measures are necessary to meet the proposed standard an iterative procedure was followed. By reviewing the problem areas in detail, a first set of tailor made improvement measures were proposed. These measures (denoted as package A) were modelled and the effect was computed with the same model framework and a 100-year simulation. Based on the results, additional measures were proposed for the remaining failing areas and again evaluated by simulation (package B). The final set of measures determined in this way (package C) consisted of 1750ha additional open water storage, 700m3/minute additional pump capacity, and improvement or real time control of about 400 weirs. The total investment for these measures amounted to euro US$364.6M.
Cost benefit ratio
To evaluate the proposed standards, the cost benefit ratio of the required investments has been computed. The cost-benefit ratio is a clear monetary approach, which can be applied here, as there is hardly any safety risk related to heavy rainfall. The costs are determined by the proposed measures. The benefits are equal to the reduction of the annual risk caused by flooding. This kind of analyses had, until now, been uncommon for large-scale water systems as the computation time to determine the probability distribution function was considerable. However, the present data availability and computer simulation models make risk analyses applicable on a large and detailed scale. The risk of flooding is defined as probability times consequences, and can be determined with:
E(S)= ?S(x)dP(x)
Here E(S) is the expected average annual damage, S(x) is the damage caused by water level x, and P(x) is the probability of water level x. The integration is needed to deal with the complete range of all possible water levels. Hence, to determine the risk of flooding, two functions are needed. Firstly, the probability density function of water levels, which is equal to the derivative of the before determined probability distribution function. And secondly, a water level damage function. The determination of a proper damage function usually invokes a lot of discussion and limits the accuracy of the absolute risk. However, when a damage function is consequently applied to compare different water systems, or to compare different measures within the same area, some impreciseness is acceptable.
For this study a GIS-oriented unit-loss damage model was made to assess water level-damage functions. In our model only direct first order damage was assessed. Direct first order damage is measurable damage caused by physical contact with water. Higher order, indirect and intangible damage (see figure 3) were neglected, as they are small in proportion to direct damage for small-scale inundations and hard to estimate as they depend on many more factors then a high water level.
The unit-loss model counts items categorised in terms of relevant units. The relevant units were taken according to the legend of a commonly used digital land use map in the Netherlands, which distinguishes in over 20 kinds of land use in grid cells of 25*25 m. The damage assigned to every item was calculated with depth-loss functions and data from the Dutch Agricultural Economics Research Institute LEI. The depth-loss functions were applied per grid cell to the actual land use and altitude of the area.
Results
To evaluate the proposed standards the benefit and cost of all measures were computed for the various scenarios listed in Table 3. The total annual risk for 2050 was computed at US$12.5M a year. The benefit of the measures was calculated as the present value of the decrease in annual risk compared to the 2050 climate scenario without measures. The present value was calculated with a term of 50 years and a rate of 4%. Furthermore, the present value of the cost of the measures was calculated after the measures were spread out over a period of 15 years, as they cannot be constructed at once.
The spatial variation of the risk over the area ranges from US$0 to US$13 per hectare per year, with an average value of US$65 per hectare per year (see Figure 4). This kind of risk spread maps appeared to be highly useful to explain to non-engineers the impact of measures, and the differences between measures.
On the basis of the results, the following remarks can be made:
• The increase of risk due to climate change (2050) was estimated at 50%, whereas the expected increase of the rainfall intensities was only about 10%. The rather big increase of risk can be explained by the fact that the return periods of heavy rainfall events (and floods) decrease more than the 10% change in intensity, but happen roughly twice as often.
• Even after package C still 4 % of the areas did not meet the proposed standards. Moreover, it seemed very difficult to have all areas fulfill the proposed standards. Apparently, the standards are too rigorous for some areas.
• It is relatively easy to reduce the risk from US$12.5M to US$6.5M per year (package A). However, it becomes difficult to reduce the risk further, because the most obvious bottlenecks can be solved with some easy and effective measures.
• Real time control measures proved to be especially effective while these are not very costly and easy to implement compared to the other measures.
It was also found that the standards cannot be easily adapted in such a way that the standards do lead to cost efficient measures. Even within the same land use functions the differences in damage, measures and benefit of measures are too big to change the return periods for the different land use functions.
The cost-benefit ratio per water system showed differences between a CB-ratio of 0.1 (favourable) up to over a 100 (very unfavourable). Despite the inherent uncertainties in risk modelling, this information is useful to determine which measures should be taken first and which measures should not be taken.
The management of the water board has decided not to take over the proposed standards blindly, but to start with the most cost effective measures. This means that for each measure the cost benefit ratio has to be within a range of up to 3. Periodically, the system will be re-evaluated to determine which additional measures are necessary.
Implications and recommendations
In the past, water systems were designed with simple rules of thumb, for example for the pump capacity or maximum water velocity. These design rules are replaced by more sophisticated standards in the course of time. The present standards are based on the water system behaviour, such as the proposed failure probabilities for flooding. The newly proposed standards, which better take into account the system characteristics, can be considered an improvement, but still cannot cope with all the 21st century challenges in water management.
The proposed standards are in fact an oversimplification for the enormous investments needed to adapt the water systems to the new climate conditions. A cost benefit analysis is therefore recommended in addition to these standards. The benefits of measures are equal to the reduction of flood risk and these benefits can nowadays relatively easily be computed. The surplus value of such an analysis is that it forces you to show what you want to do, and what the consequences are of these choices. By doing this it helps the decision maker choose between measures. However, the authors strongly recommend not using the cost benefit analyses for an economic optimisation. The cost benefit analyses should, in addition to the standards, only assist the decision making process whether measures are sensible or not.
Author Info:
O.A.C. Hoes is from the Department of Water Resources, Delft University of Technology, email: o.a.c.hoes@citg.tudelft.nl; W. Schuurmans is from Nelen & Schuurmans Consultants, email wytze.schuurmans@nsconsult.nl, and J.Strijker is from Hollands Noorderkwartier Water Board, email: j.strijker@hhnk.nl.
TablesTable 1 Table 2 Table 3