Risky business for dams
18 April 2005C Richard Donnelly and Michael Morgenroth discuss the use of risk based procedures to assist in making informed and proactive dam safety decisions
IN THE spring of 1889, the largest dam failure incident in North American history occurred. Following a period of heavy rains, the 22m high South Fork dam, located just upstream of Johnstown, Pennsylvania, broke releasing over 20M tonnes of water and debris into a narrow valley, killing more than 2200 people. Over a century later, Canada’s most significant dam safety event took place during the devastating Saguenay floods of 1996. In this case, eight dams were overtopped and thousands were displaced, making this event one of the largest natural disasters in Canadian history.
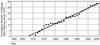
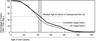
Dam owners are facing increasingly difficult decisions about the ways in which finite financial and human resources should be allocated to ensure the continuing safe operation of ageing dams. Without such investment, dam failure is not only a possibility but can be an expected consequence of lack of proper maintenance and diligence by a dam owner. For example, with the introduction of the National Dam Safety Program in the the US, a process of reporting dam failures and dam safety incidents was made an integral part of dam safety practice. The results of this monitoring programme have shown that, in the period from 1993 to 1999, 421 dam failures of varying degrees of severity have occurred (Hydro Review 1999) which translates to an overall probability of failure in the order of 6 x 10⁻⁴ failures per dam year (Figure 1).
As shown in Table 1, numerous other researchers have reported similar dam failure rates with the overall average equivalent to about one dam failure every 2500 years. On the basis of these data, it is apparent that dams can be expected to continue to fail unless action is taken to systematically assess and maintain the structures.
It is also of note that this rate of occurrence of dam failures and dam safety incidents in the the US follows a surprisingly uniform linear trend which appears to be similar for dams around the world. It is of interest that the occurrence of major tailings dam failures world-wide shows a similar, roughly linear trend.
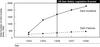
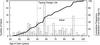
On the basis of these data, it is apparent that not only will dams continue to fail, but that the rate of occurrence is, to some degree, predictable. While spectacular failure incidents can usually be correlated with the occurrence of a large hydrological or foundation problem, it is a fact that, throughout North America, dams are aging which can only increase the chance of failure. According to the National Performance of Dams Program (NPDP), at least 85% of the more than 75,000 dams in the the US will be in excess of 50 years old by 2020. Perhaps more significantly, most of the large dams throughout the US are also approaching old age. As shown in Figure 2, the distribution of ages of large dams in Canada and the the US is very similar with the median age (as of 1999) in the range of 40 to 45 years.
For individual dam owners, problems associated with dam aging can be even more acute. In the case of Ontario Power Generation’s almost 200 dams, nearly two thirds are in excess of 50 years old (Figure 3).
As dams age, owners face major decisions about the ways in which finite financial and human resources are allocated to ensure their continuing safe operation. However, decisions on the extent and timing of the often significant expenditures required to maintain, rehabilitate or, in some cases, decommission a dam are seldom clear cut, due to the fact that the useful life of dams depends on a number of complex factors such as the original design criteria, the construction materials and methods used, operational conditions, maintenance practices and changes in safety criteria which may occur as a result of development downstream from the structure or due to a re-evaluation of dam safety parameters.
Risk-based dam safety assessments
In the early 1970’s, risk analysis concepts for the evaluation of existing dams were introduced by a taskforce of the hydraulics division of the American Society of Civil Engineers (ASCE). Implementation of those techniques to support major dam safety rehabilitation decisions occurred during the latter part of the 1970’s, with the inception of modern-day dam safety programmes in the the US (FERC 1979). These guidelines formally adopted probabilistic assessment procedures to provide a rational means of predicting the occurrence of floods or earthquakes. Throughout the 1980’s, several organisations adopted risk-based approaches for: assessing the safety of individual structures (Kreuzer and Bury 1984; Bury and Kreuzer 1985); as part of an overall dam safety assessment (Gruetter and Schnitter 1982); or for the design of new structures (Atkinson and Vick 1985).
There was, however, some reservations as to the applicability of such assessments for the analysis of dams. For example, Peck (1984) acknowledged the value of these probabilistic methods for assessing the risk of major floods and earthquakes but cautioned that such techniques should not be used to replace the redundant ‘defenses’ required in any dam design to guard against unforseen geological hazards. Whitman (1984) compared the traditional design approaches with those based on risk and reliability prompting others to review the applicability of risk assessment techniques more closely. In the latter part of the 1980’s, the United States Bureau of Reclamation (USBR) introduced guidelines for incorporating the results of risk analyses into the decision-making process (USBR 1989).
During the 1990’s, the use of risk-based procedures gained momentum. In 1992, the US Army Corps of Engineers began a programme to develop computer models which used a probabilistic approach, combined with detailed condition assessments, to support decisions on major rehabilitation works. In Canada, similar, research was undertaken by Acres International to develop a computerised, risk-based procedure to evaluate competing rehabilitation options (Donnelly and MacTavish 1997; Westermann 1998; de Meel et al. 1998). During this same period, BC Hydro adopted a qualitative, risk-based approach to assist in the assessment of complex dam safety issues (Nielsen 1993; Salmon and von Hehn 1993; Nielson et al. 1994; Salmon and Hartford 1995). More recently, other organisations such as Ontario Power Generation are adopting a risk-based, or failure modes and effects analysis (FMEA), approach as a tool for assessing and prioritising dam safety issues. In the the US, FERC has mandated the use of risk based procedures for assessing the safety of high hazard dams following the Probable Failure Modes Analysis (PMFA) approach.
Evaluating dam safety
In principle, the concept of a risk-based analysis for evaluating dam safety problems is quite simple. In its most basic form, a risk-based assessment involves establishing the reliability of a given structure in performing its intended function, with reliability primarily being a function of age or condition. However, since factors which affect reliability cannot be predicted with certainty, it is necessary to establish the ‘risks’ associated with a particular event occurring. In the context of dam safety, this risk is defined as a measure of both the probability and consequence of an adverse effect on health, property or the environment (CSA, 1991). Or, in more general terms, risk equals the product of the probability of an occurrence of an event (typically a dam failure event) with the consequences of the event.
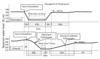
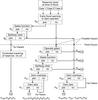
In practice, however, risk is not usually associated with an easily predictable, single event due to the fact that failure usually occurs as a result of an uncertain chain of events, with the chance of any individual event happening along the chain conditional on all of the other events preceding it occurring first. Failure consequences can also be uncertain since these consequences can be mitigated by human actions which are typically also defined by a chain of uncertain events. This general concept for the establishing risk is indicated in Figure 4. To analyse these often complex issues, a series of well-defined steps, as described by Hartford et al (1995) and others have been established.
Step 1: Failure modes definition and screening
As a first step in the process, all conceivable failure modes are identified and screened to eliminate any which are not credible. This often represents one of the most valuable steps in the process promoting creative and critical thinking amongst the investigations.
Step 2: The event-tree method
To address the complex interrelationship of occurrences that make up a single event, the fault or event-tree method (Evans 1974) has been adopted for dam safety assessments. An event tree commences with an initiating event, which is usually related to a major earthquake, flood or rainfall. Stemming from this initial event is a series of possible outcomes each with its own conditional probability of occurrence. As represented in Figure 5, the event tree is essentially a model of all of the possibilities that the future might hold. In addition, it represents, at least to some extent, the analyst’s subjective and site-specific view of the future.
Step 3: Establish the conditional probability of failure for each of the individual events
The probability of occurrence associated with initiating events (such as earthquakes or floods) can usually be established on the basis of accepted numerical techniques. However, as reported by numerous practioners (Salmon and Hartford 1995; Hartford et al. 1995; Payton et al. 1998; Hartford 1988), the major drawback to the use of risk-based procedures is the fact that the assignment of the conditional probability of occurrence for subsequent events must be based on engineering judgment following the principles of ‘subjective or degree of believe probability evaluation’ (Nielson et al. 1994). As discussed later, in many cases, a capacity-demand procedure can be used to attempt to overcome this, sometimes, significant drawback.
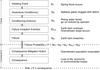
Step 4: Establishing the Consequences of Failure
For a typical dam safety assessment, consequences of failure may include: economic losses; environmental losses; and loss of life.
Traditional cost estimating techniques are used to evaluate the possible damages associated with a dam failure event, including such issues as lost energy benefits. Similarly, environmental losses can be estimated on the basis of the costs associated with reinstating the site after the failure.
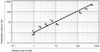
Often however, the prime driving force in any dam safety assessment is the hazard the dam presents in terms of the potential for loss of life. Research by DeKay and McClelland (1993) is often used in an attempt to relate the potential loss of life associated with dam failure with warning time, the ‘population at risk’ and the type of flood expected.

where,
LOL = potential loss of life
P = total downstream population
ef = exposure factor (percentage of people likely to be in
residence at the time of the event)
x = 2.982 WT – 3.790 (for deep fast-flowing water)
= 0.759 WT (for broad shallow flood water)
WT = warning time in hours.
As shown in Figure 6, a reasonable agreement between the predicted and actual loss of life is obtained using Equation 1.
However, at best, estimating the potential for loss of life is subjective, and it can lead to a breakdown in the dam safety assessment process; particularly in jurisdictions where, politically, there is a desire to ensure that risks associated with loss of life are eliminated. In such situations, since it is not possible to accept consequence, the dam safety assessment attempts to define design standards to drive probability to ‘zero’. As this is theoretically not possible, and often impractical, many jurisdictions are now attempting to redefine the consequence parameter. In the province of Québec for example, the risk to public health is defined in terms of Persons at Risk (PAR) so as to allow a less emotional means of defining appropriate dam safety standards. Currently (2005) the Canadian Dam Association (CDA) is updating Canadian Dam Safety Guidelines. As part of this update the concept of Persons to Evacuate as a measure of downstream risk tolerance is being explored. The advantage to this approach is the defined risk parameter represents a positive approach, that is the hazard the dam presents to the public can be defined by the total number of people that would need to be evacuated in the event of an hypothetical dam failure as opposed to the numbers of people that may potentially loose their life or be put at risk.
Step 5: Assessing risk
As discussed previously, risk is simply the product of overall probability of failure established under Step 3 with the consequences of the event as determined under Step 4. Once the level of risk for a particular dam safety event is established, the question of what an acceptable level of risk is must be addressed.
For economic or environmental consequences, acceptable limits are usually established on the basis of the ability of the individual dam owner to absorb the cost. For example, BC Hydro reports that economic risks are determined on the basis of ensuring a negligible effect defined as a probability of occurrence of 10-6 per year. In BC Hydro’s case, this equates to a tolerable risk-cost in the order of US$8,000 per year (Salmon and Hartford 1995).
As discussed previously, establishing acceptable standards for ‘tolerable’ loss of life are much more difficult and contentious. Indeed, in many cases, it is not possible. For example, the Province of Ontario would consider the loss of a single life to be unacceptable. There is some guidance in the literature on the subject. For example, Neilson et al (1994) and Salmon and Hartford (1995) present details of tolerable loss of life criteria from various organisations, as summarised in Figure 7.
Both Ontario Power Generation and the Province of British Columbia have used these types of concepts to set Incremental Loss of Life thresholds for the definition of very high Incremental Consequence Category (ICC) dams at 100 persons.
Establishing the probability of occurrence
A traditional risk assessment relies on engineering judgment to establish conditional failure-probabilities for occurrences following the initiating event. This subjective approach can provide very valuable results, allowing practioners to prioritise remedial work and competing remedial solutions for mitigating risk, in a rational, defendable manner. In fact, one of the great benefits of a risk-based assessment is the process itself which promotes creative thinking by focussing on assessing and discussing problems, and the potential for problems, in great detail. However, such qualitative approaches can be treated with suspicion as justifications for specifying, or delaying, major dam safety decisions. For example, in 1986, the US state of Illinois allowed the use of risk analysis procedures to attempt to justify the selection of lower spillway requirements for existing dams. However, due to the perceived uncertainties associated with the method, the state required a public hearing to be held to describe the basis for the spillway design with the burden of proof placed entirely on the owners (Payton et al. 1998). Clearly, the use of a qualitative and subjective method for assessing dam safety in such a forum would be problematic. Indeed, the reluctance of numerous organisations in adopting this type of analysis as a sole means of assessing safety is often justified. An example of the significant effect that uncertainty can have on an individual risk assessment is reported by Bury and Kreuzer (1985). In their assessment of the risks associated with a concrete gravity dam, they noted that, in some cases, the uncertainty associated with the risk can exceed the entire median risk itself (reference Table 3).
The problem with risk-based dam safety assessments, therefore, reduces to one of establishing reliable and defendable values for probability of occurrence.
The most common tool for quantifying the risk of failure is a detailed analysis of past performance and historical records (de Meel et al. 1998). However, for this approach to be applicable, a statistically significant number of similar events must have occurred to similar structures in order to allow the investigator to extrapolate probability into the future. Since, for most dams, loading conditions and the characteristics of the structure itself are unique, a quantifiable method of assessing failure-probability on the basis of physical parameters is needed. For this reason, reliability concepts were explored as a means of quantifying failure probability.
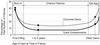
Reliability theory typically defines failure rate as a function of age or service condition in terms of the three distinct periods. During the initial period of operation, the potential for failure is relatively high as a result of ‘burn-in’ or ‘infant mortality’ failures. After this burn-in period, the chance of failure is typified by a reasonably constant, usually relatively low, rate of failure.
This period represents unexpected failures resulting from chance events such as floods or earthquakes during the useful service life of a structure. This ‘useful life’ period extends to a point where the failure rate begins to increase significantly, reflecting wear-out or old age problems. A review of dam foundation failure incidents, as indicated in Figure 8, indicates that this typical ‘bath tub’ distribution of failures does occur as dams age.
Although the rate of failure of older dams is not necessarily related solely to wear-out, these results do suggest that it may be possible to establish a more quantitative assessment of the failure-probability of the various conditional events which lead to a dam failure using reliability concepts.
The capacity-demand analysis method
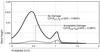
In a probabilistic analysis, it is necessary to establish the chance that a given load or distribution of loads is greater than, or equal to, the capacity of the structure to resist load; or, in other words, the chance of failure. The limit states design method (Lust and Wu 1998) offers a method of determining this chance by comparing the statistical distribution of the demand on a system with its capability to resist this demand using probability-density functions. These functions can be conveniently represented by constructing a Warner diagram that represents the probability-density functions describing the variations in capacity and demand for any given engineering criterion. As shown in Figure 9, the product of the cumulative probability distribution of capacity, which represents the chance that the strength of the material is below the criterion defining failure, with the probability-density function representing demand produces a function defining the chance of failure at any given value of the selected engineering criterion. The total chance of failure can then be determined by integrating this function over all values of the criterion (be it stress, fatigue, liquefaction potential, etc). In this way, a unique, quantifiable value for the total mean probability of failure is established, which can be defended on the basis of the input parameters.
In mathematical terms, this means:

with

where
P = probability of failure
Fc = cumulative probability density of capacity
fc = probability density of capacity
fd = probability density of demand
x,y = the selected engineering criterion.
A recent example of the use of the capacity-demand procedure is shown below.
Evaluating risks associated with a 90 year old steel conduit
This capacity-demand analysis approach was used to evaluate the probability of rupture of a riveted 5.5m diameter steel conduit made from early 20th century vintage structural steel plate as part of an overall dam safety assessment for a hydroelectric facility located in Canada (Morgenroth et al. 1999). In the initial stages of the study, a detailed visual inspection showed that, although the conduit was generally in excellent condition, a portion of the conduit was found to have buckled. In this area, the shell had been eroded to 75% of the original design thickness, as a result of water movement over the years. The question of the safety, therefore, reduced to a matter of establishing the probability of rupture of the degraded steel conduit under the varying loading conditions imposed by the operation of the hydroelectric facility.
To apply the capacity-demand method, variations in the stresses acting on the conduit were modelled by a single, mean probability-density function describing the range of stresses acting on the conduit steel. The variation in capacity was determined by accounting for such factors as imperfect process control in the making of the material, and the conservatism of the steel mill in specifying their material. The variability of plate thickness, and the joint efficiency were accounted for by means of a standard deviation or x% confidence limit. Consequences of failure, including direct repair costs, the loss of production during the repair and downstream consequential damages were calculated using conventional cost and estimating techniques. Individual risks for each branch of the event tree were then summed over all possible failure scenarios to establish the total station risk-cost. Subsequently, the net risk benefit associated with implementing remedial action designed to mitigate the chance of failure was established and compared with completing remediation scenarios to develop a prioritised list of rehabilitation options.
The results of the event-tree analysis showed that an annual net risk benefit of about US$120,700 could be achieved by rehabilitating the buckled section of conduit which led to a decision to implement the necessary repairs on a priority basis. The major advantage of this method was that disagreements could be resolved on the basis of a rational discussion of the engineering parameters selected for the analysis, instead of subjective discussions about the validity of the failure-probabilities selected.
Forecasting failure-probability
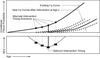
The capacity-demand analysis described in the previous example represents a snapshot of the condition and failure-probability at a particular instant in time. Given that the capacity of most structures deteriorates with time, a mechanism is needed to forecast failure-probability in order to permit defendable, proactive budgetary planning to be performed. As shown in Figure 10, the capacity-demand procedure can be used as a tool to achieve this objective. The method can account for changing conditions on the capacity side, such as a progressive breakdown of riprap. On the demand side, factors such as increasing performance requirements or raising of maximum water levels can be included in the analysis.
Once the relationship of failure-probability with time has been established, it is possible to make use of life cycle management models (Donnelly and MacTavish 1997; de Meel et al. 1998) to assess the optimum timing for major capital expenditures. In this approach, a base line assessment is made which essentially involves evaluating the risks usually in terms of the economic consequences associated with a ‘do-nothing’ alternate.
In the case of a relatively new dam, this do-nothing approach may represent the least-cost alternative. However, as the structure ages, the probability of failure and, therefore, risk increases such that, at the same point, least-cost strategy shifts to selective rehabilitation or replacement.
To assess the optimum intervention timing, various intervention alternatives can be assessed to establish a least-cost option. For each alternate, risk exposure is computed by considering the change in failure-probability that results from implementing the intervention alternative. By assessing the direct costs associated with implementation of competing rehabilitation schemes, and the associated risk-costs, the economics of implementing competing schemes, with respect to the base case alternative, are evaluated by means of Monte Carlo simulations. This permits the optimum timing for implementation of a particular rehabilitation alternative to be determined by calculating net present values at each year of implementation.
In this way, transparent and proactive decisions on the extent and timing of major rehabilitation work can be made and, more importantly, defended.
Conclusions
Risk-based dam safety analysis is becoming increasing popular to assist dam owners in making often difficult decisions on major capital expenditures for ensuring dam safety. The method allows competing remediation options intended to mitigate the often complex series of events that can lead to dam failure to be assessed in a rational and qualitative manner. However, many practitioners have noted that a major weakness of the approach is its reliance on engineering judgment to establish failure-probability.
The use of a risk-based dam safety analysis, coupled with the capacity-demand procedure, provides a mechanism to make proactive, transparent and defendable decisions on the scope and timing of major dam safety issues. The major advantage of this approach is the fact that decisions can be defended on the basis of physical input parameters rather than subjective estimates of failure-probability.
Author Info:
C. Richard Donnelly, M.A.Sc., P.Eng., Division Manager, Wind and Water Power; Michael Morgenroth, Senior Engineer, PhD, P.Eng., Acres International Limited, Niagara Falls, Ontario, Tel: +1 905-374-5200, Fax: 905-374-1157, E-mail: rdonnelly@acres.com, mmorgenroth@acres.com
TablesTable 2 Table 3 Table 1 Table 4