Stress tests
17 September 2004Tengfei Bao and colleagues modified traditional dam engineering theory to devise a new model for measuring stresses during the construction of China’s Three Gorges dam
Quantitative analysis of observation data obtained from concrete dams can give useful information about the behaviour of dams, permit prediction of future values and detect anomalies as early as possible to enable a timely response [1-3]. It can also contribute to options regarding the building process and to control of the construction programme [4]. As a rule, traditional statistic models can be used in quantitative analysis of observation data:
(1) E = fH(H) + fT(T) + ft(t)
where E is an observed effect (displacement, strain, stress or joint movement) of a dam on a certain date; fH(H) is the hydrostatic component due to water level variations; H is the water level in the reservoir; fT(T) is the thermal component due to temperature variations; T is the temperature; ft(t) is the irreversible, time-dependent component due to imperfect elasticity of the dam and foundation or to any time-dependent phenomenon; t is the time from the reference date to the date of observation.
Before applying the statistic model, appropriate functions are selected for fH(H), fT(T) and ft(t) respectively, according to the physical nature of the problem. For example, fH(H) can be represented by a third-degree polynomial function of H for concrete gravity dams. By applying expression (1) to different dates, a system of equations with unknown coefficients is obtained and is solved using the least squares method; the solution yields the values of the coefficients. By substituting these coefficients into expression (1), the hydrostatic, thermal and irreversible (or time) effects are obtained.
With the separated effects, structural behaviour can be appraised. This model can only be used for data obtained after the beginning of reservoir filling, because the first term in the model involves the water level in the reservoir. This meant that it couldn’t be applied to Three Gorges during construction because the dam was enclosed by cofferdams and no hydrostatic pressure acted on it. For quantitative analysis of observation data obtained during construction of the Three Gorges dam, a new model had to be established.
Observation data show that when the Three Gorges dam was heightened during construction, some effects (e.g. strain and stress) increased simultaneously. Clearly, these effects were partly caused by the dam’s own weight. As a result, the traditional statistic model was modified into the following:
(2) E = fW(h) + fT(T) + ft(t)
where fW(h) is the component caused by the weight of the constructed part of the dam; h is the dam height, which increases during construction.
Mathematical formula of self-weight component fW(h)
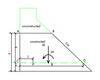
During construction, concrete was placed layer by layer, the dam height increased simultaneously, and the vertical normal stress:

at point P in the dam (Figure 1) increased because the weight of the concrete above the horizontal plane through point P increased. Assuming that the height of the dam is h at a certain instant, the formula of fW(h) is derived hereinafter.
According to dam engineering theory, linear variation of vertical stress between the upstream and downstream faces on all horizontal planes is assumed. This assumption is substantially correct, except for horizontal planes near the dam base. To obtain the vertical stress:

at point P, the horizontal plane through point P is considered and the vertical normal stresses:

and

of the upstream and downstream faces of the plane are calculated:
(3)


where W is the weight of the concrete above the plane; M is the moment of the weight of the concrete above the plane about the centroid of the plane. B is the width of the plane from upstream to downstream faces. The stresses can also be written as follows:
(4)


is the unit weight of the concrete; h2 is the distance from the plane to the top of the constructed part of the dam; m is the slope of the downstream face.
The vertical normal stress:

at point P is developed as follows:
(5)


where L is the horizontal distance from point P to the upstream face.
Substituting h2 = h - h1 (h1 is the vertical distance from point P to the foundation line) into expression (5), the following expression is obtained:
(6)

Expression (6) shows that the self-weight component only correlates with dam height and that it can be expressed by a linear combination of h, h2 and h3 because parameters h1, B, L, m and

are constants for a given point. So a third-degree polynomial function of h is selected to represent the self-weight component:
(6)

where a1, a2 and a3 are coefficients.
Selection of functions for fT(T) and ft(t)
The results show that stresses were strongly influenced by local temperature variations caused by heat of hydration of cement in the first two years after concrete placing. This meant that local temperature variations had to be taken into account when selecting the function for the thermal component
- f
(7)

where b1, b2 and b3 are coefficients; T is the local temperature; t is the time from the reference date to the date of observation.
Irreversible effects are usually associated with time-dependent phenomena such as creep and plasticity. From a dam safety point of view, they are usually the most critical and it is desirable that their rate of progress be estimated and followed. Irreversible effects are initially found to be ruled by the law of nonlinear rapid variation and later by the law of nearly linear slow variation. The following function, including linear and nonlinear terms, was selected to represent the irreversible component ft(t):
(8)

where c1 and c2 are coefficients;

t is the time mentioned above.
In its complete form, the new model is given by:
(9)


where a0 is a constant representing the difference between the observed effect on the reference date and the computed value.
Application
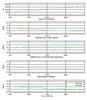
The new model and least squares method were used to analyse stresses at point S01SC01 near the toe of the Three Gorges dam between April 1997 and December 2000. The regression coefficients, multiple correlation coefficient R and standard deviation S are shown in Table 1. The stresses due to self-weight and temperature variations and the irreversible stresses are shown in Figure 2.
Analysis of precision of results
Table 1 shows that the multiple correlation coefficient R is greater than 0.98 and that the standard deviation S is only 0.00951MPa which is 4.36% of the stress at the end of year 2000. Therefore the precision of the results is satisfactory. The deviation between the calculated curve and the measured one as indicated in Figure 2 is very small, so the model could be used to analyse stresses obtained from Three Gorges.
Analysis of the contributions of the various causes to the stresses
For quantitative analysis of the contributions of self-weight, temperature and time-dependent phenomena to the stresses, the amplitude of annual variation of stresses in 1998 was separated and the various effects (self-weight, temperature and time effects) are given in Table 2.
(1) The self-weight effect - Figure 2 and Table 2 show that the increase in concrete self-weight most strongly influenced stresses during construction Temperature variations and time-dependent phenomena had less influence. The amplitude of annual variation of the self-weight components is about 58% of the total annual amplitude.
(2) The temperature effect - Stress variation showed a strong negative correlation with temperature; when temperature increased, the tensile stresses at the toe of the dam decreased (or the compressive stresses increased); otherwise, when the temperature decreased, the tensile stresses increased (or the compressive stresses decreased). This is consistent with the general law of variation of stresses at dam toes. The amplitude of annual variation of the thermal components is about 23% of the total annual amplitude.
(3) The time effect - Time-dependent components varied rapidly at the beginning, but as time lapsed, variations decreased. Eventually, the stresses showed a tendency towards stabilisation. All these variations agree well with those that the measured stresses indicated. The amplitude of annual variation of the time-dependent component is about 19% of the total annual amplitude.
Conclusions
The new model yields good regression results with a large multiple correlation coefficient and a small standard deviation. There was good agreement between the measured stresses and the stresses calculated by use of the model. The functions are well selected and the model can be applied to analyse stress during construction of the Three Gorges dam.
The laws of variation of the various effects, separated by the model, with their causes are consistent with the general laws developed in concrete dams. The proportion of the various effects in the total amplitude of annual variation of the stresses is reasonable, further validating the model.
Author Info:
Tengfei Bao, Zhongru Wu, Chongsi Gu, Dongjian, Zheng are with the College of Water Conservancy & Hydropower Engineering, Hohai University, Nanjing 210098, P. R. China.
For more information email: baotengfei@yahoo.com.cn or fax: +86 25 8371 3059
This study was supported by the 973 Programme of China (grant no. 2002CB412707) and the National Natural Science Foundation of China (grant no. 50139030). Their support is gratefully acknowledged.
TablesTable 1 Table 2